management system SDRC

Case Study

Effective Vaccine Management (EVM) System

Overview

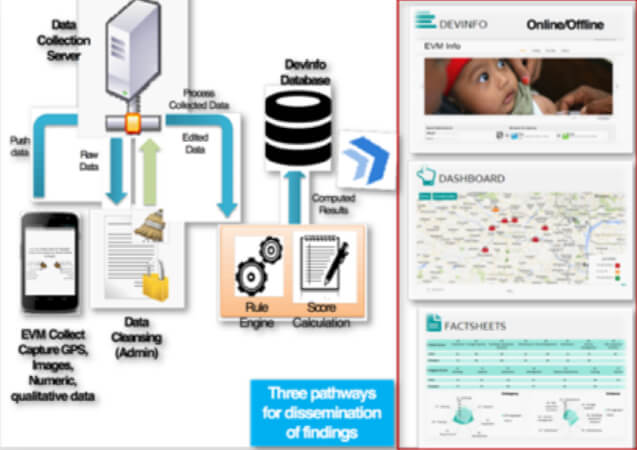
The EVM tool is a World Health Organisation (WHO) recommended protocol used to assess vaccine storage and delivery facilities and provide crucial data on their effectiveness against best-practice benchmarks.

Client

Unicef_logo

Locations

Bihar, Assam, Chhattisgarh, Jharkhand, and Uttar Pradesh.

Issue

Slow Data Collection and Analysis.

Static Reports Producing Aggregate Results.

Data collection and analysis processes were time consuming and limited in outreach as data collection was paper based. Information dissemination was primarily through static reports that present the aggregate results.

Action

Digitize the Paper Based Data Collection into Android Mobile Application.

SDRC provided technical support to UNICEF to re-engineer the paper based data collection to using android smart-phones.

An android data collection application was developed (adapted from ODK, an open source tool) which could be accessed with low cost android based devices.

EVM DATA FLOW

The following screen shot provides a schematic representation of the mEVM data flow:

sdrc_edit_EVM_Caste_Study

The solution can be conceived in three stages:

Data Collection

The android based tool is used to collect data using electronic forms that can be accessed through a mobile app. The forms are re-usable and the cost of implementation decreases over a period of time as there is very low operating costs. The system can capture GPS, Images, and qualitative data besides quantitative data. The form design is flexible and new questions can be introduced in a short time. It also includes options to enforce skip patterns and validation checks to ensure user provides valid inputs and the form is complete. Multiple copies of the form are saved at different location to ensure data backup. Since the input is digital, there is no challenge of legibility. This tool has both online and offline capabilities for data collection using laptops, mobile devices like smart phones and tablets.

Data Collation

Once data is collected, it is submitted to a central server using mobile internet or through a Wi Fi network. The data is then collated online based on a rule engine and relevant scores are generated.

Data Visualisation

The computed statistics is then presented in the form of a dashboard. The dashboard includes a Google map on which the surveyed health facilities are overlaid. Users can zoom in and navigate to a specific health facility. They are also able to view the specific scores for a facility as well as the aggregated scores for a particular level. The dashboard presents the score across critical indicators including vaccine arrival, temperature control, storage capacity, infrastructure, maintenance, stock management, distribution, and vaccine monitoring systems. It also allows to query and compare indicators across time and geography.

An example of the online dashboard to monitor the criteria and category scores for a particular vaccine store or health facility.

The dashboard includes useful features such as displaying the data as spider chart, column chart, and downloading the view as a PDF file or sharing it as a web link. The spider charts offer the additional benefit of allowing comparison across two time periods. Thus, users can quickly overlay the scores on a spider chart and compare current situation with baseline data.

A snapshot of the EVM Portal

An example of the one pager factsheets

An example of improvement plan

EVM DevInfo Adaptation

EVM Data Tree

Another innovation done by SDRC is the EVM data tree. This application provides access to the actual response provided by the respondents while the survey was carried out. The application is very interactive and allows users to visualize information about the vaccine stores and health facility in a rich visual interactive manner.

Users can also drill down on a particular facility to get detailed information about the response for the questions under a particular criteria and category.

Since the data on key indicators is disseminated online, it enables decision makers at various levels to access the information “anytime, anywhere” and develop plans for improving the efficiency and effectiveness of the system. The mobile EVM innovation by UNICEF is a stepping stone towards an effective vaccine supply and logistics system to ensure there are no wastages or stock-outs, and high quality vaccines reach children on time.

Impact

impact_coloumn_chart-img
Add

Warning: Illegal string offset 'title' in /var/www/html/sdrcapp/wp-content/themes/understrap-child/single-service.php on line 63

Notice: Uninitialized string offset: 0 in /var/www/html/sdrcapp/wp-content/themes/understrap-child/single-service.php on line 63


Warning: Illegal string offset 'location' in /var/www/html/sdrcapp/wp-content/themes/understrap-child/single-service.php on line 64

Notice: Uninitialized string offset: 0 in /var/www/html/sdrcapp/wp-content/themes/understrap-child/single-service.php on line 64


Warning: Illegal string offset 'timeline' in /var/www/html/sdrcapp/wp-content/themes/understrap-child/single-service.php on line 65

Notice: Uninitialized string offset: 0 in /var/www/html/sdrcapp/wp-content/themes/understrap-child/single-service.php on line 65